


Which country is killing our planet?
Five Killer Charts


Good morning – here are your five chart for the day. Each one comes snap stat, quick take and why it matters. Skim, steal, forward (but always credit!!).
The US frequently criticises China over pollution, but this criticism seems a bit unfair. For decades, China served as the world's manufacturing hub through a straightforward trade arrangement: Western countries effectively exported their carbon emissions by having China manufacture goods at very low prices, while China exported deflation back to these countries in the form of cheap products.
This dynamic has shifted with the recent trade wars and increased tariffs under the current US administration. Moreover, China appears increasingly committed to transitioning to a green, electrified economy, whilst America continues to generate significant pollution. This contrast is what today's first chart illustrates.
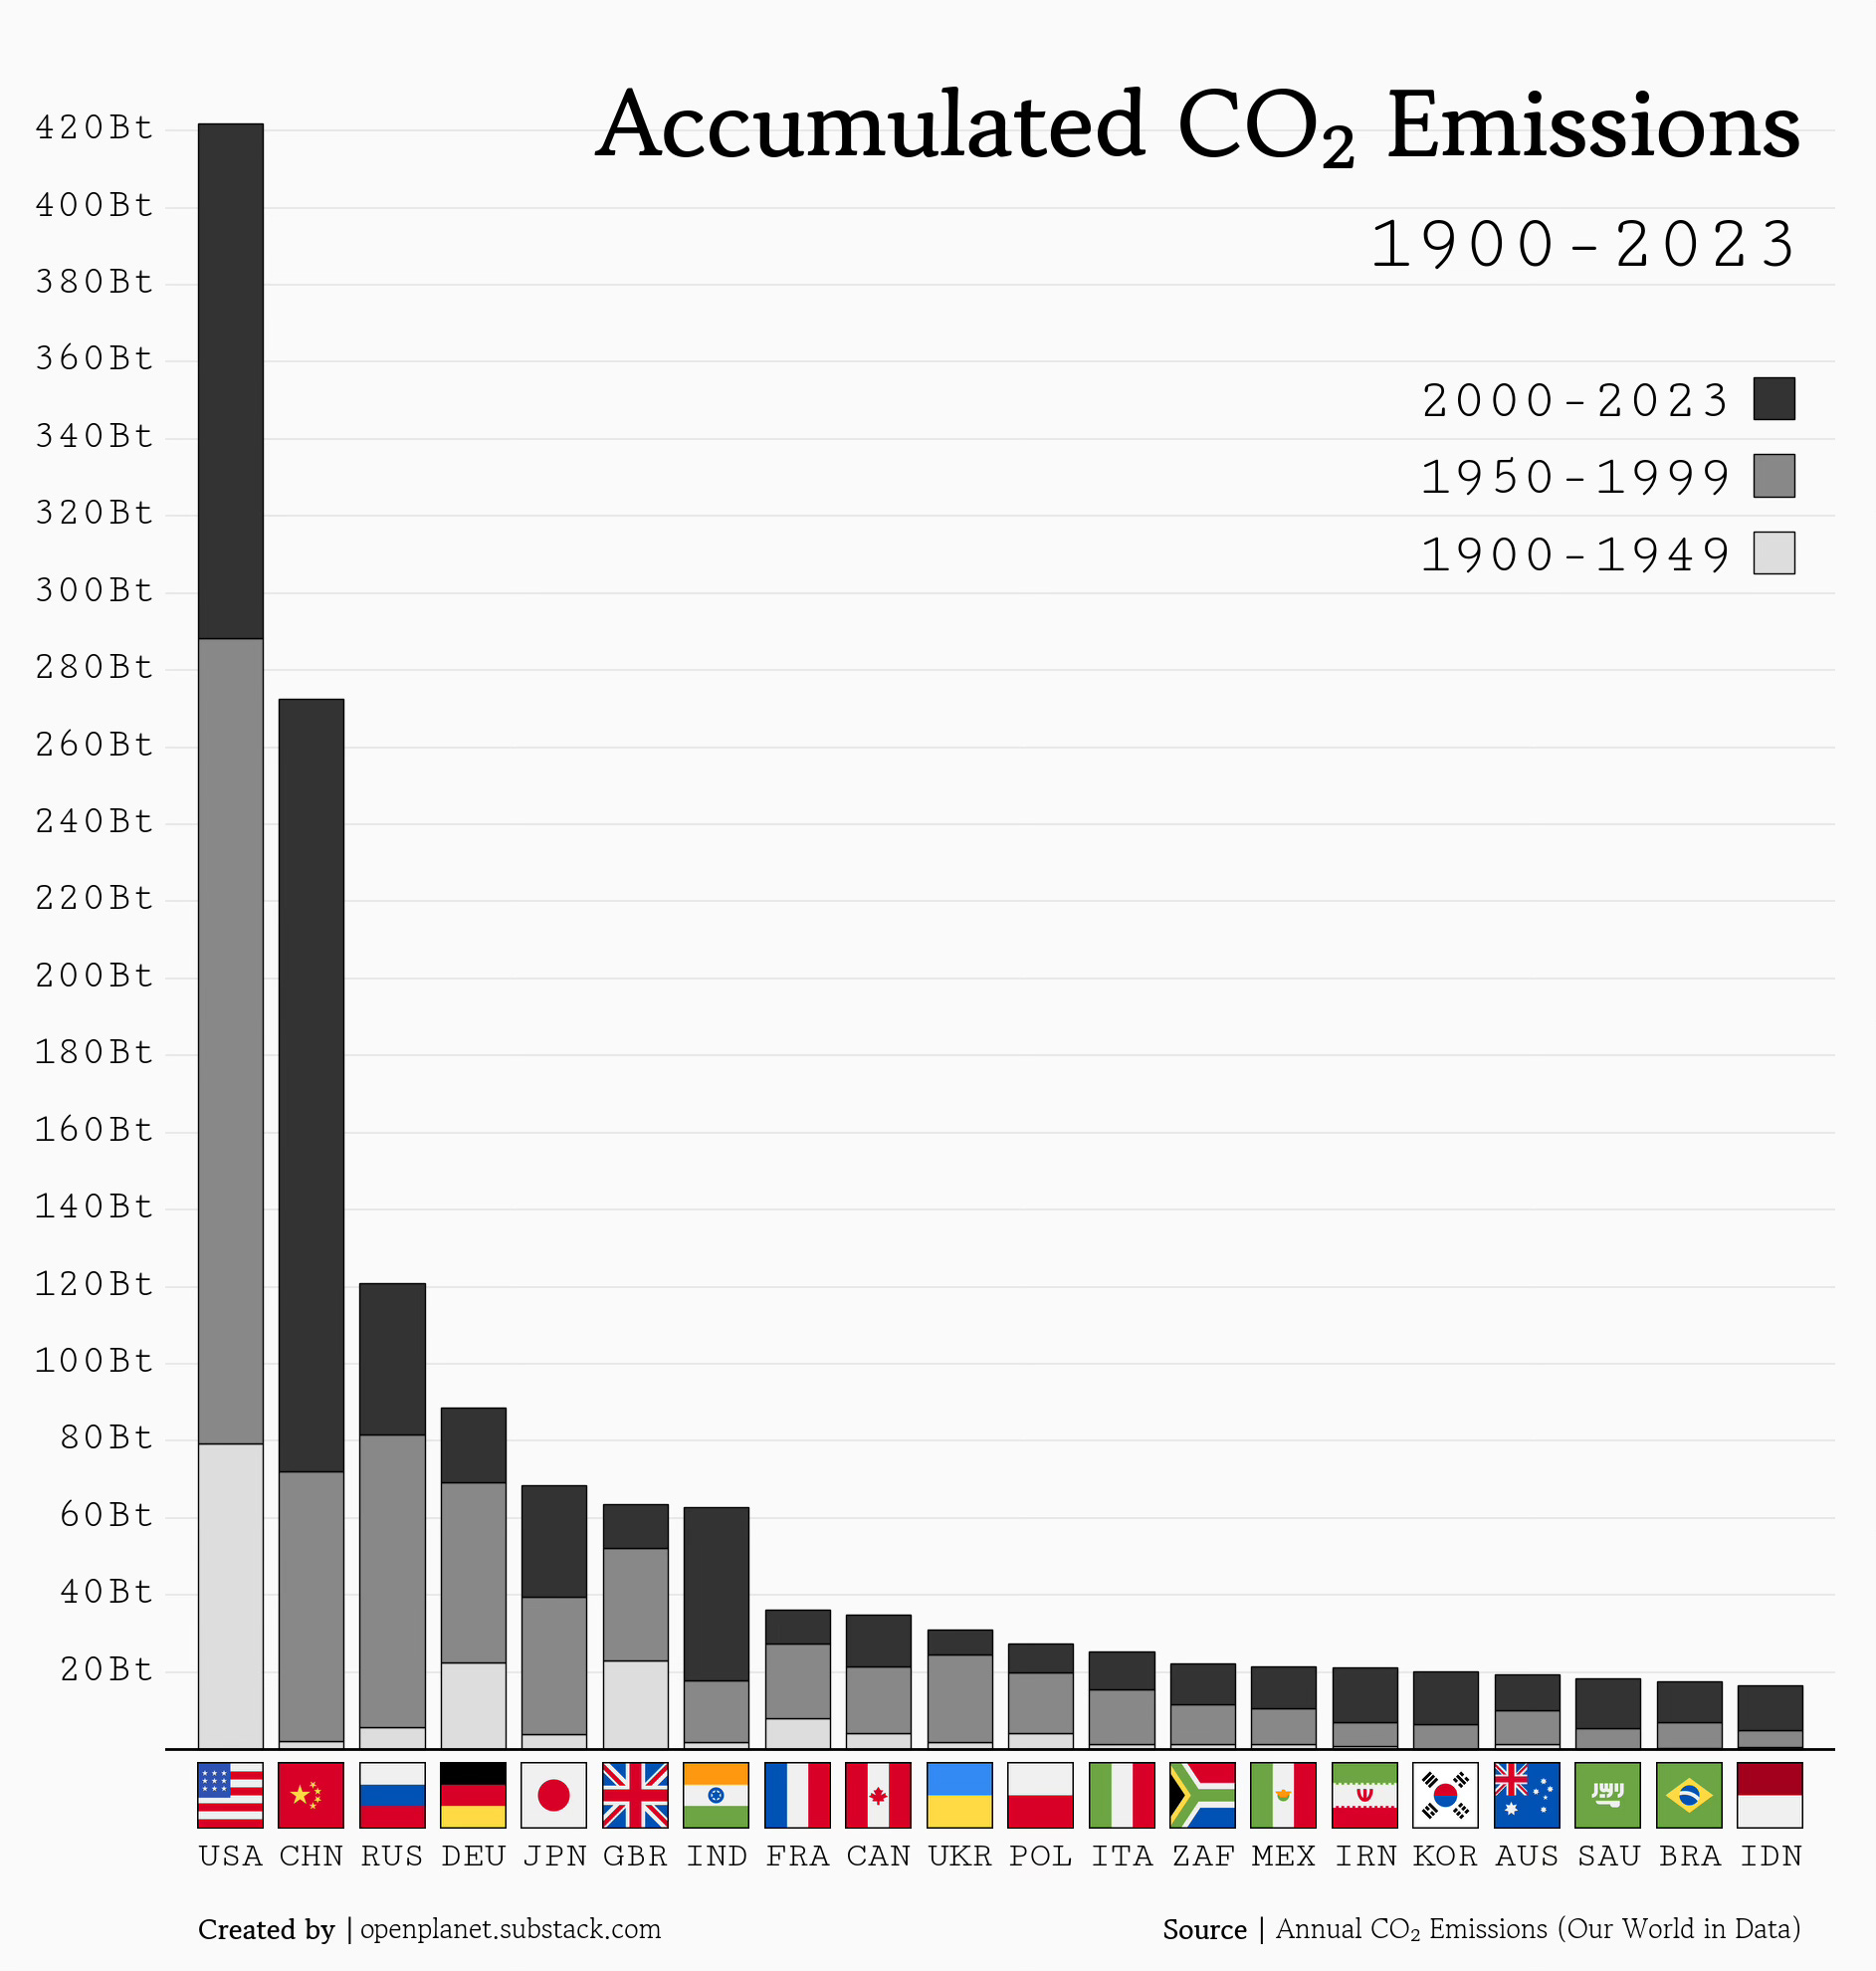
CHART 1 • America’s carbon legacy still lingers
The United States has emitted more carbon than any nation in history. Its 400 billion‑tonne tally over the centuries amounts to roughly a quarter of the world’s cumulative CO2 load, overshadowing China’s later surge (which the world seems to obsess over lately). While global emissions growth has slowed to 0.2% a year since 2015, the planet is still heading for a record 37.4 billion tonnes of emissions in 2024.
Snap stat – Around 400 billion tonnes of CO2 emission have come from the US since 1751 – 24% of the global total.
Quick take – America's past pollution created expectations for climate leadership, but the current administration has moved away from green commitments.
Why it matters – Climate negotiations keep getting stuck on one question: who's going to pay?
Steal-this-caption – “A quarter of the carbon since 1751 was Made‑in‑USA.” #FiveChartsDaily
Source: Open Planet
Want the other four? Become a paid subscriber.
Keep reading with a 7-day free trial
Subscribe to Killer Charts to keep reading this post and get 7 days of free access to the full post archives.