


Trade policy uncertainty continues
Five Killer Charts


Good morning – here are your five chart for the day. Each one comes snap stat, quick take and why it matters. Skim, steal, forward (but always credit!!).
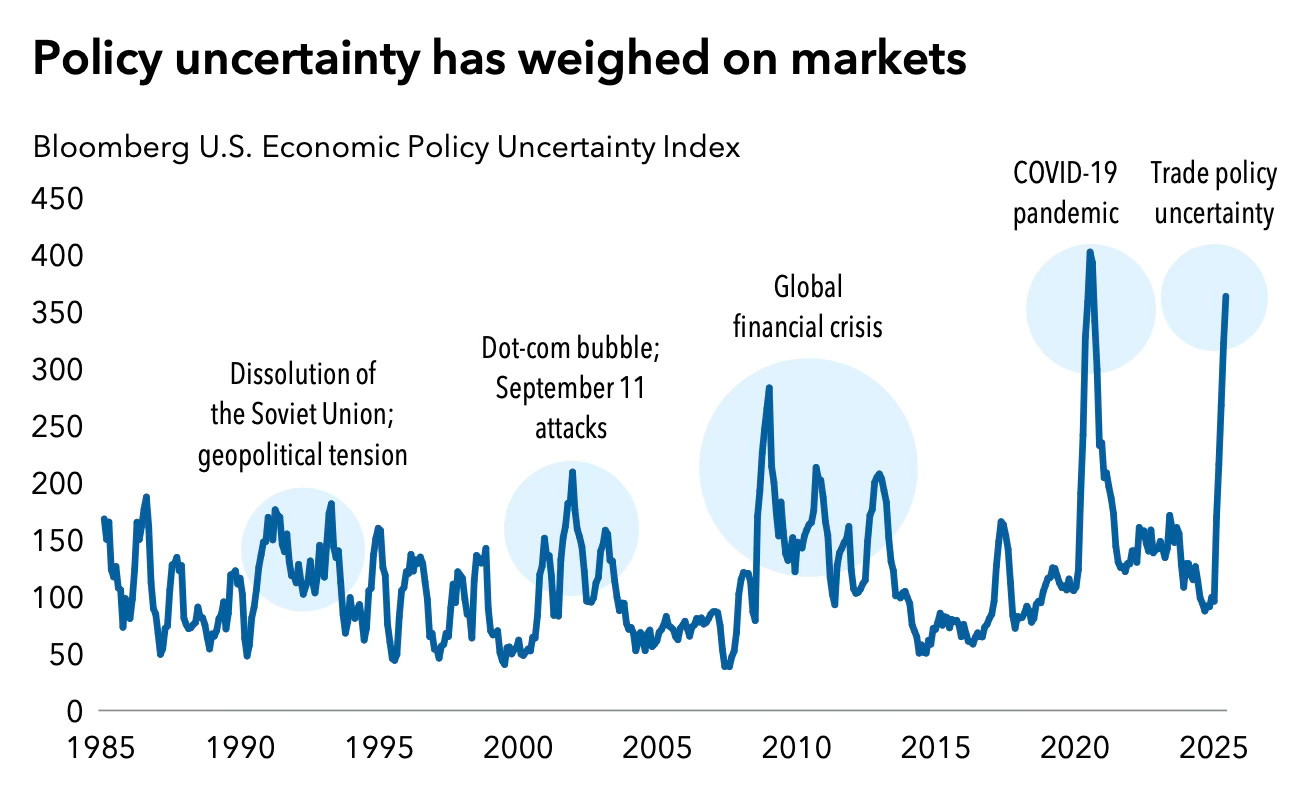
CHART 1 • Policy Uncertainty Weighs on Markets
If it feels like we're living in the most uncertain times ever, you're not hallucinating. Bloomberg's US Economic Policy Uncertainty Index has hit levels that would make even seasoned traders queasy, with this chart showing spikes rivalling those seen during the Soviet Union collapse, 9/11, and the Global Financial Crisis. But here's what's different this time: the current uncertainty isn't just about one event – it's about everything.
The trade policy uncertainty component alone has shattered records, hitting over 10 for the first time. During Trump's previous term, that same measure peaked at just 4.58. We're not just talking about normal political volatility here. We're witnessing what economists call "perpetual uncertainty machine" territory, where the predictable pillars of the modern economy are crumbling.
The chart's annotation highlighting "Trade policy uncertainty" captures the current moment perfectly – we've moved beyond normal political cycles into something more destabilising and persistent.
Snap stat – Policy uncertainty index hitting levels comparable to Soviet collapse and 9/11
Quick take – We've entered the age of perpetual policy chaos and uncertainty
Why it matters – Chronic uncertainty kills investment, hiring, and economic growth momentum
Steal-this-caption – "When uncertainty becomes the only certainty markets have"
Source: Capital Group
Want the other four? Become a paid subscriber.
Keep reading with a 7-day free trial
Subscribe to Killer Charts to keep reading this post and get 7 days of free access to the full post archives.