My English teacher Mr Cairncross would've hated this title. "It's are data being manipulated, dear boy," he'd snap.
Somewhere along the way, primarily in American English, we decided data is singular. Once you accept that collective agreements can change fundamental rules, you realise how malleable our "facts" might actually be.
The same is true with data.
When shadows speak more than official statistics
A hedge fund manager in Manhattan stares at satellite images of Chinese oil storage tanks. She's not looking at the tanks themselves but at the shadows inside them.
These tanks have floating roofs that rise and fall with oil levels, creating crescent-moon shadows that reveal exactly how full they are. In 2014, a widely used industry database listed about 500 Chinese oil storage tanks, but Orbital Insight’s satellites identified about 2,100. The shadows don't lie.

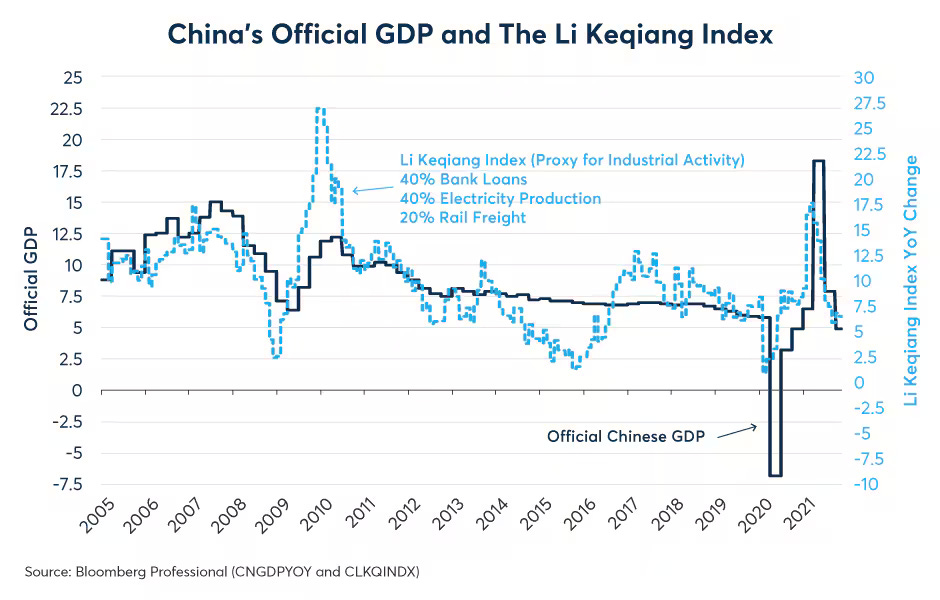
This isn't a conspiracy theory. In fact, it is a multibillion-dollar alternative-data industry, valued at roughly $10–15 billion, that exists because Wall Street has little trust in China’s official statistics.
This trust was lost some time ago and if we were to pinpoint why, I would have to write a book on it. Obviously ideology plays a role: China is not a democracy and has little interest in being completely transparent with the demos (or the people).
In 2007, China's future Premier Li Keqiang told US diplomats (in cables later leaked by WikiLeaks) that GDP figures are "man-made" and "for reference only". Instead of his own government's statistics, he tracked electricity consumption, rail freight volumes, and bank loans. This is a frank admission that even China’s top leaders doubt the reliability of their official economic data.
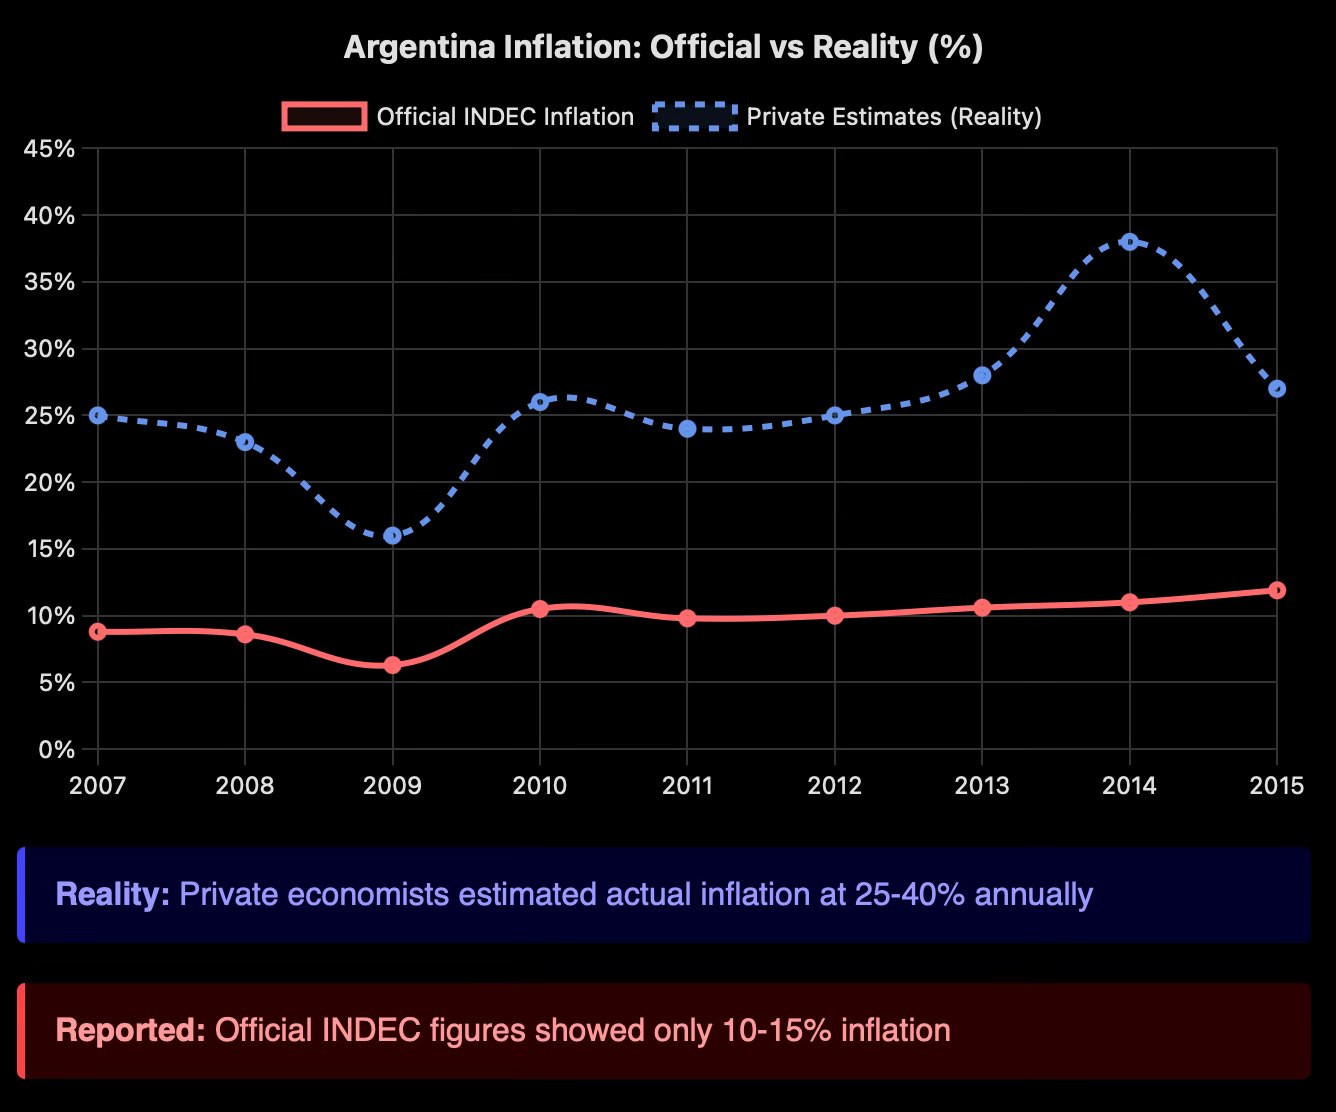
The same pattern repeats: Turkey’s statistical agency TÜİK has repeatedly replaced its leadership, stopped publishing detailed item-level price data in 2022, and is widely accused of understating inflation compared to independent estimates. Argentina invented numbers until investors created their own indices. Russia's data is so unreliable that analysts track oil exports using ship transponders instead.
We've grown comfortable dismissing these as problems of autocracies. Democracies, we tell ourselves, have independent statistical agencies, professional civil servants, institutional safeguards. Our numbers are real.
But are they? When the statistics we rely on can be influenced by political pressure, when methodology can be tweaked to please those in power, when unfavourable numbers can cost you your job, then the independence we take for granted becomes an illusion. And without independent statistics, democracy itself becomes impossible.

Are we seeing the loss of statistical independence?
On 1 August, President Donald Trump fired Commissioner Erika McEntarfer via Truth Social. The Bureau of Labor Statistics had reported disappointing employment figures (just 73,000 jobs added, with previous months revised down by 258,000). He said she had "faked the Jobs Numbers before the Election to try and boost Kamala's chances of Victory."
This was an accusation he made without providing any evidence and which multiple experts, including his own former appointees, said was technically impossible.
McEntarfer was a career statistician with two decades of federal service, appointed by Biden and confirmed by the Senate 86-8, showing bipartisan support even in a Democrat-controlled chamber.
As former Commissioner William Beach, a Trump appointee himself, explained, the commissioner only sees the jobs report on the Wednesday before release – about 36 hours in advance – far too late to change it. Moreover, BLS data comes from surveys of over 122,000 businesses and government agencies covering roughly 666,000 worksites, processed by hundreds of career staff following published methodologies refined over decades.
Nonetheless, her removal was described as unprecedented in the agency’s 140-year history.
Trump's team did complain about methodology, criticising seasonal adjustments and large revisions as a “black box,”but these were political attacks on complexity itself, not serious technical critiques. They never proposed alternative methods or engaged with the actual mathematics.
To be fair, there are legitimate concerns about BLS data quality. Initial response rates for the establishment survey are now around 58-65%, lower than pre-Covid, and the household survey typically reaches the high-60s to 70s.Chronic underfunding has forced sample reductions.
These are real problems that economists across the political spectrum acknowledge. But they require more resources and modernisation, not political interference. Firing commissioners for bad numbers won't improve response rates; it will only undermine the credibility of whatever numbers come next.
Trump's attack on the BLS employed several manipulation techniques simultaneously: he attacked the messenger (firing McEntarfer), questioned methodology without offering alternatives ('black box' claims), and most importantly, undermined public trust in the statistics themselves by declaring them 'fake' without evidence. But these tactics are just part of a larger framework. Let’s go into this now.
The four methods of statistical manipulation
These four methods escalate from crude to sophisticated, forming a hierarchy of deception that every citizen should recognise.
1. Outright fabrication
This is the crudest method and rarely happens in developed democracies. Why? Because it's too easy to catch and the consequences are severe.
When Argentina's Kirchner government simply invented inflation statistics, international investors stopped believing any Argentine data and created their own indices. The lesson was clear: once you're caught lying, no one trusts you again.

2. Methodological manipulation
This is far more common because it's harder to detect. You're not lying about the numbers; you're changing how you calculate them.
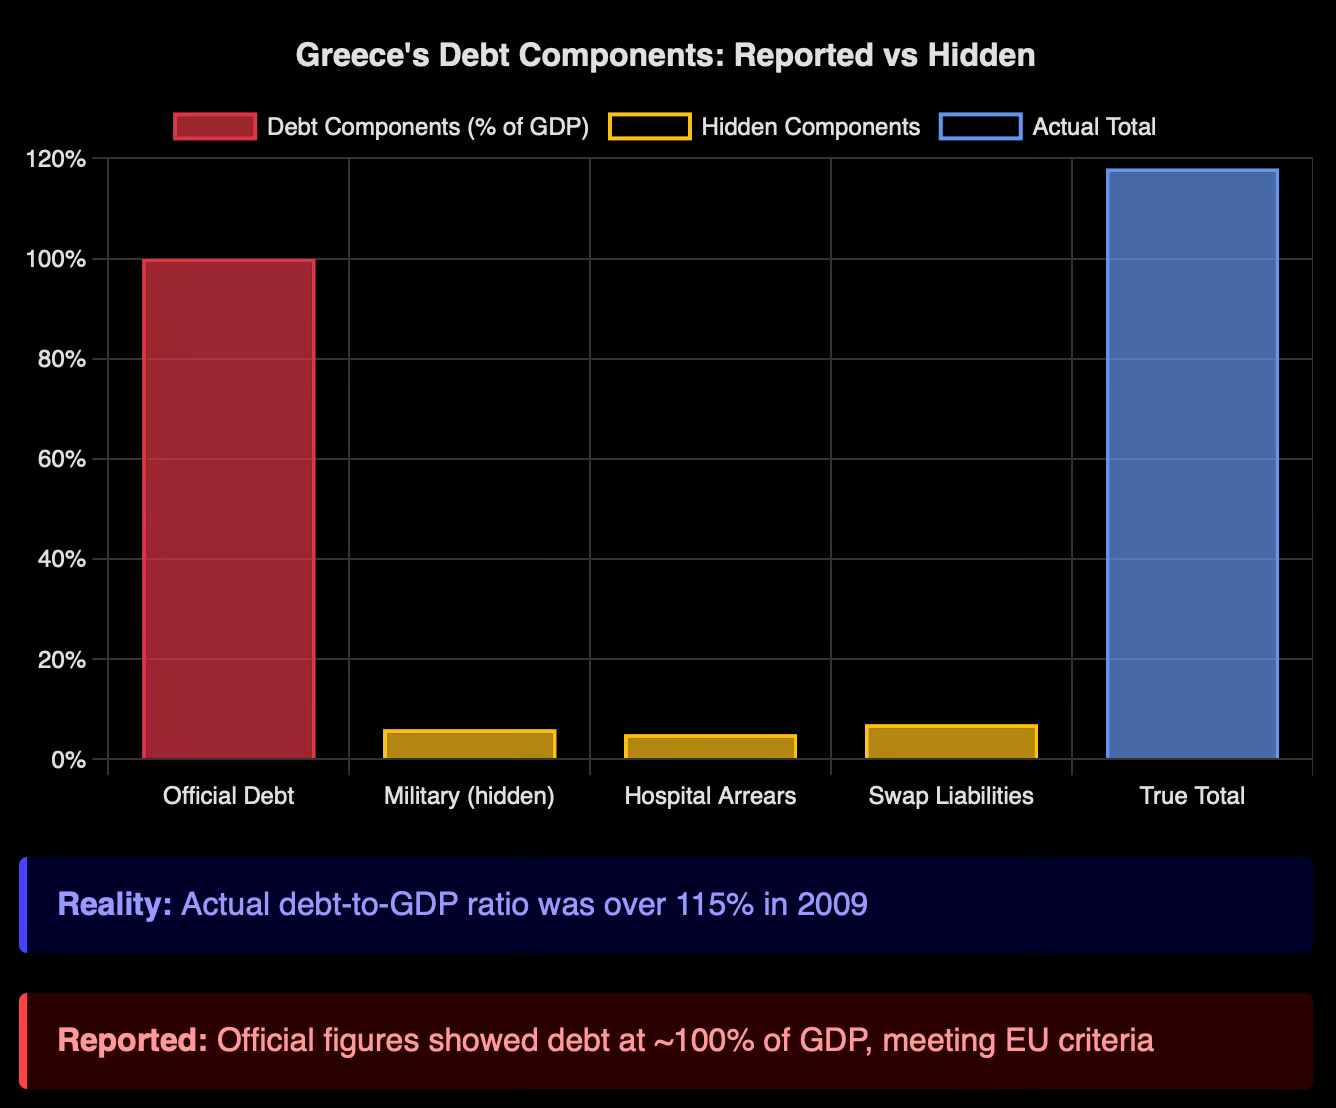
Greece did this before its debt crisis. They reclassified military spending, moved hospital arrears off the books, and used swaps to hide debt. The numbers looked fine until the whole scheme collapsed in 2010.
Or consider seasonal adjustments. Every January, employment drops because Christmas workers are let go. Statistical agencies use formulas to smooth out these predictable patterns. But tweak the formula slightly, and you can make a recession look like growth or vice versa. The maths is so complex that few people will spot the manipulation.

3. Presentation manipulation
This happens constantly. Same data, different story.
Politicians announce: "Best job growth in six months!" They don't mention it's still the worst in five years. They release bad news on Friday evenings when no one's paying attention, but good news gets a Monday morning press conference. When numbers are revised downward, it's buried on page twelve.
Trump exemplified this. Throughout his presidency, he celebrated positive jobs reports as proof of his success. But when negative reports emerged, like July 2025's weak numbers, he called them “rigged” and fired the commissioner. Same statistical process, opposite reactions, depending on what suited him.
4. Interpretation manipulation
This is the most sophisticated method. You don't change the numbers or how they're presented; you change what they mean.
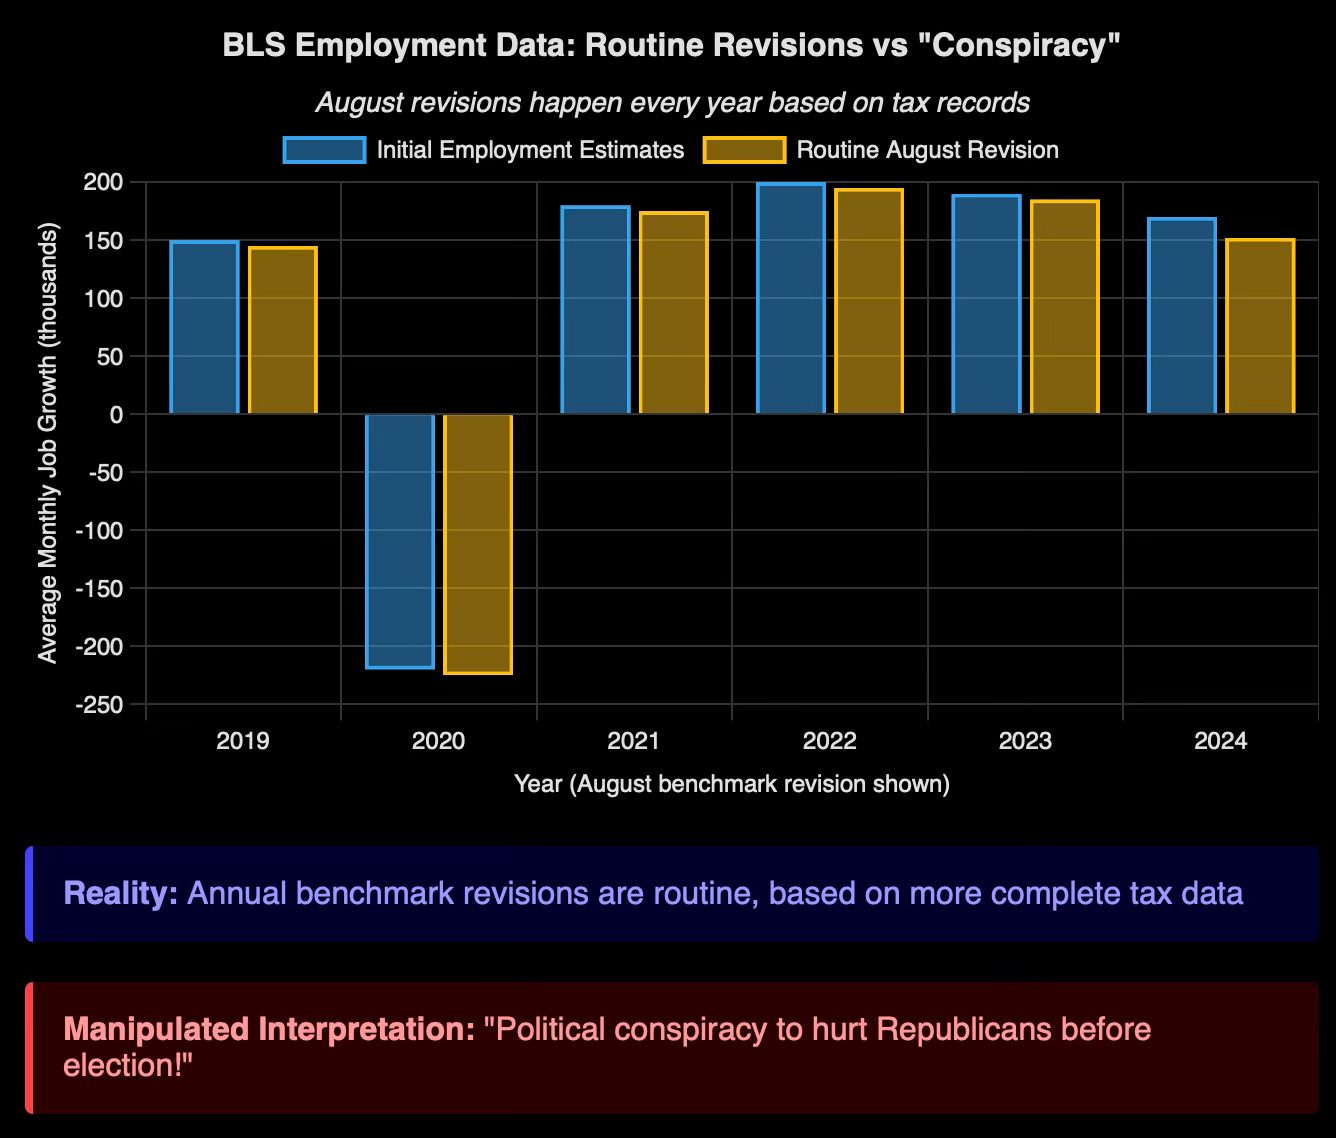
The BLS revised employment down by 818,000 for the year to March 2024 ( released on August 21, 2024), which was well before the November election. Trump falsely claimed it was deliberately timed to hurt Republicans. In reality, it was a standard annual benchmark correction, released every August based on tax-based data.

Why this matters now more than ever
We're witnessing a worldwide assault on statistical independence. Turkey’s Erdoğan has sacked multiple central bank and TÜİK leaders; Brazil’s politicians have pressured their central bank to cut rates despite inflation risks.
Governments worldwide face a brutal trilemma: massive debts requiring low interest rates, inflation demanding higher rates, and populations furious about both. When government financing needs override economic reality, statistical manipulation becomes inevitable.
In Orwell's 1984, "Ignorance is Strength" was a Party slogan. Today, instead of rewriting history, we've made all facts suspect. Trump doesn't need to control information; he just needs to convince people that every number is political, that truth itself is partisan.
Once that happens, ignorance truly becomes strength. If you can dismiss any inconvenient statistic as "fake," you're freed from reality's constraints.
Venezuela shows the endpoint. Official inflation statistics became so meaningless that shops abandoned posting prices and the economy reverted to barter. That's where statistical manipulation leads: not to controlled lies but to epistemological collapse.
The defence we desperately need
Protecting statistical independence requires structural reforms: statutory protection for agency heads removable only for cause, terms that span administrations, and external review of methodological changes.
Professional solidarity matters. When statisticians face political attack, their colleagues must defend them publicly, as William Beach defended McEntarfer. International monitoring through the UN Fundamental Principles of Official Statistics should become standard.
But ultimately, citizens must understand what's at stake. Statistical independence isn't some technocratic nicety. It's the foundation of democratic society itself.
The data is being manipulated through methodological tweaks, presentation spin, and the deliberate undermining of public trust. Once numbers become mere weapons in political warfare, democracy becomes impossible. Without agreed facts, we're left with nothing but power determining reality.
That's not a future we should accept. The integrity of our data isn't just about economics or politics; it's about maintaining the shared foundation of truth that makes civilised society possible.


